Marketing Attribution: a Data-driven Approach
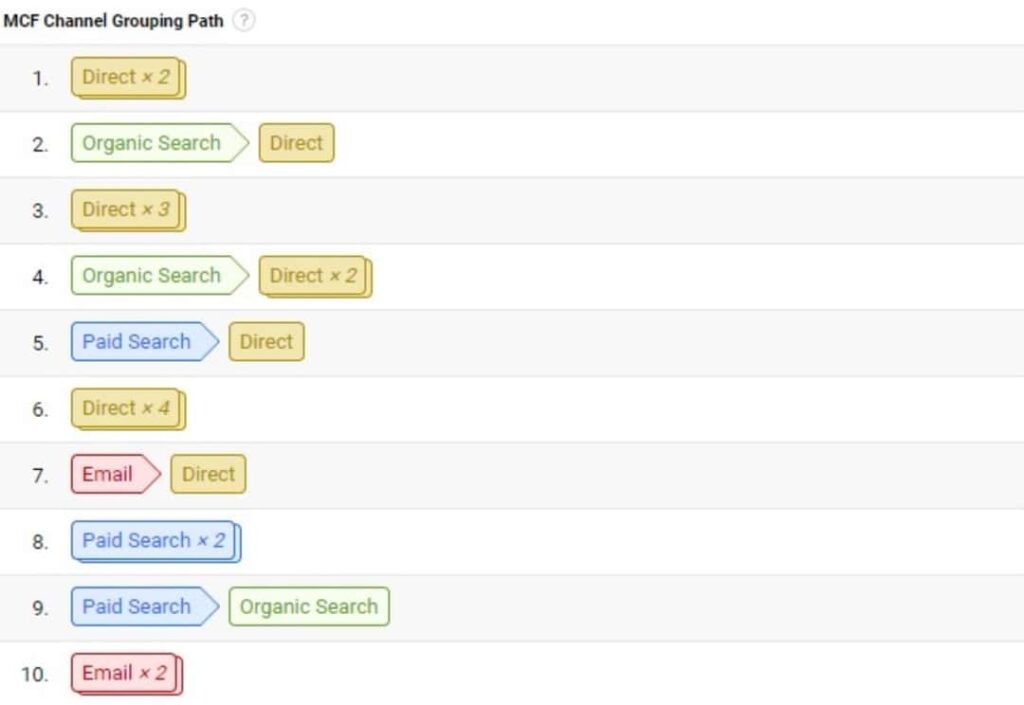
Most marketeers and analysts know: an average visitor of a website will walk through different paths of channels before they decide to buy. One can start their path via a Facebook post; another via Google search. In Google Analytics you are able to see all the different paths of your customers, under the menu ‘Top conversion paths’ (Conversions > Multi Channel Funnels > Top Conversion Paths)
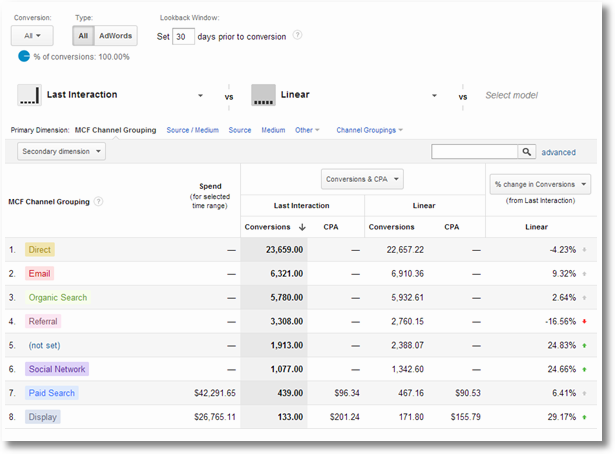
Another approach to measure how important a certain channel has been for a customer to buy is the attribution model, also to be found in Google Analytics (Conversions > Attribution > Model Comparison Tool). This model shows the last channel the customer interacted with directly before buying (last interaction model) and/or which channels had been the most helpful to reach the last interaction-channel (linear model). Google Analytics offers seven (!) different attribution models, out of which one is customizable to your own version.
However, there are a couple of important approaches that Google Analytics does not include. Below you can find the most important one.
- You cannot make an analysis about the paths that did not result in buying.
- You are forced to choose a Google model. However, it is not entirely clear which model is the best fit for you.
- There is still a clear overview missing of all the paths that have been used.
SquareMoon Attribution
Now, attribution is an essential part of determining marketing budgets and customer journeys. Therefore we have built an extra layer on top of the existing Google Analytics one. In this layer, we use the Markov chain algorithm which helps to calculate the chance of transition from one channel to another.
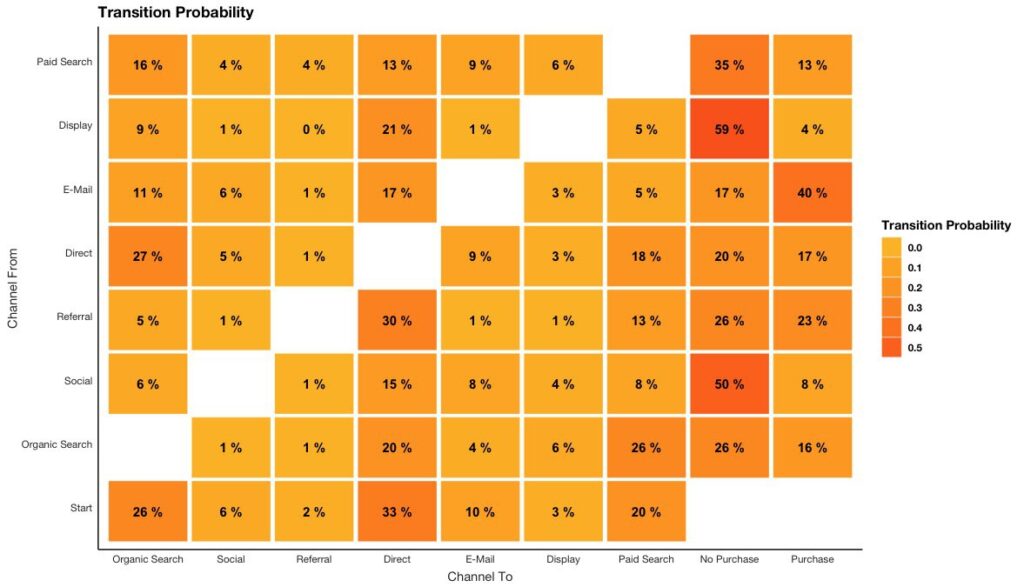
In this overview you can see:
- The chance of a customer returning after using channel X, that was reached by channel Y. (E.g: The chance that a customer returns after organic search, using referral is 1%.)
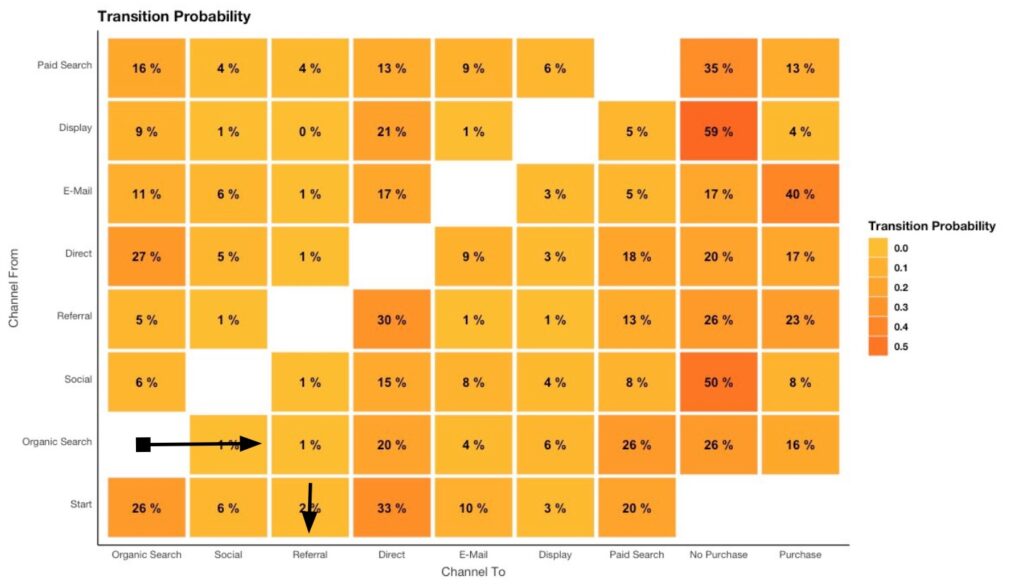
- The chance of a customer buying after using channel X. (E.g: The chance that a customer will buy after visiting a social platform is 8%.)
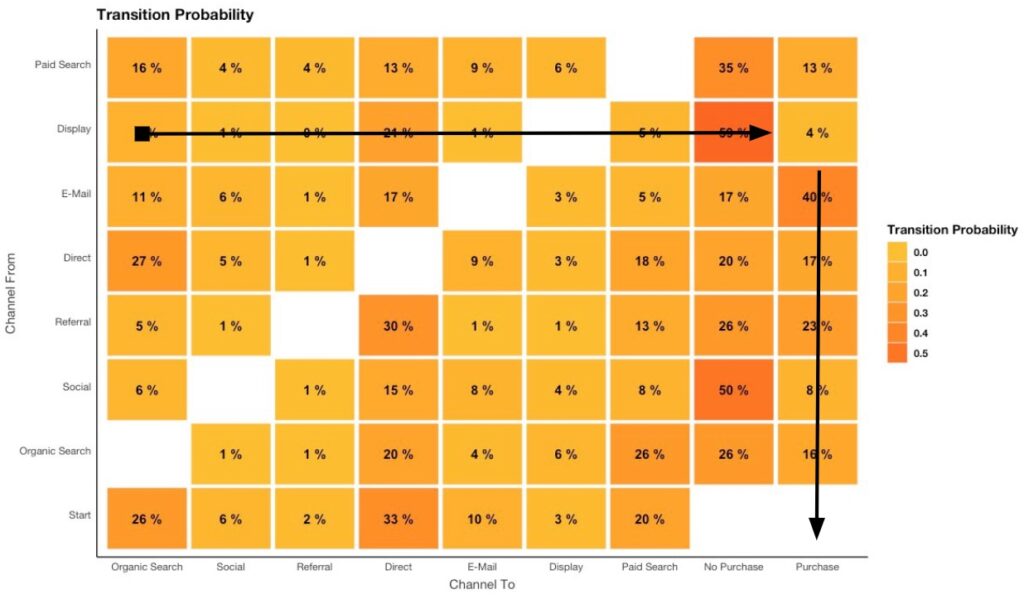
- The chance of a customer not buying after using channel X. (E.g: The chance that a customer will not buy after visiting a social platform is 50%)
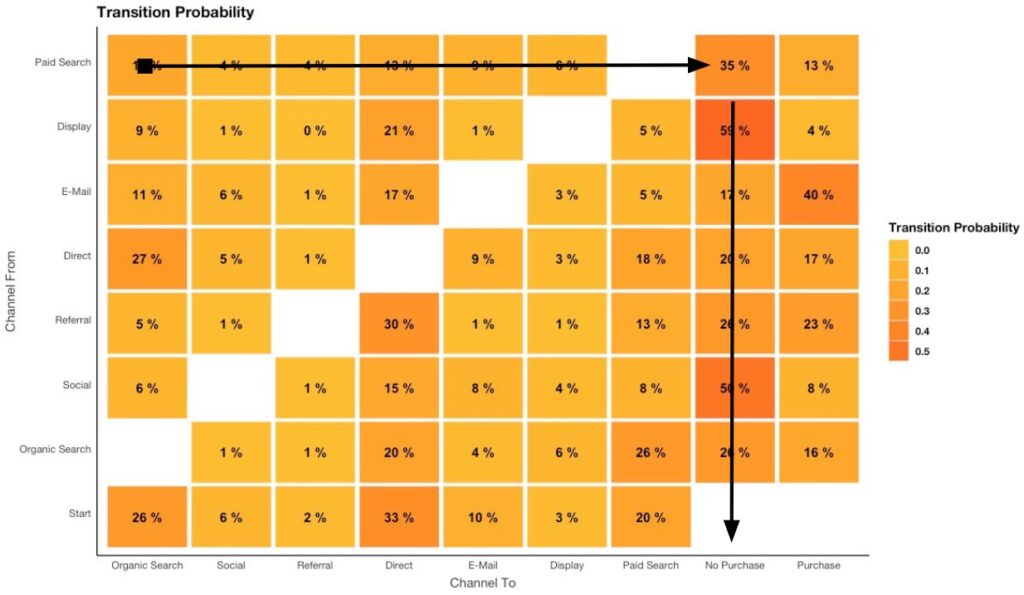
Above output is valuable information for optimization of marketing budgets.
Should you want to set up the above analysis for your own Google Analytics account, contact us by phone or email.